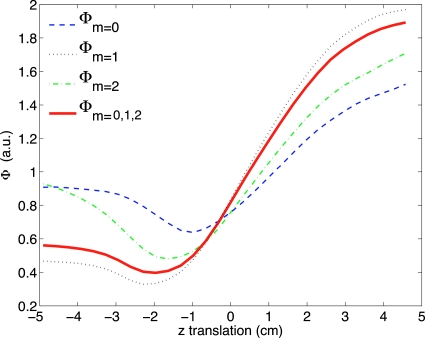
Figure 3.
Objective function values for patient A as a function of translation in axial location with the other transformation dimensions fixed. Plots the values of Eq. 2 for different moments and for the sum of moments m=0,1,2. These curve shows that the objective function is well-behaved for this patient and for this dimension. The minimum should occur at approximately −1.6 cm since we forced a translation of 1.6 cm on the original aligned data.

