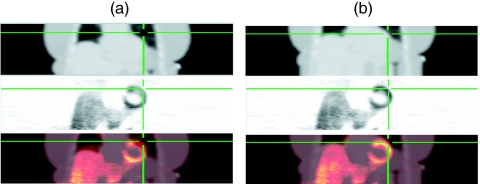
Figure 6.
Coronal views of reconstructed images from patient B ammonia PET/CT study. Column (a) presents the original attenuation map (row 1), attenuation corrected PET image (row 2), and fused PET/CT image. Column (b) presents the images after alignment with the proposed method. The alignment process reduced the incorrect attenuation correction values along the lateral free wall, removing the artifactual perfusion defect in the PET image. The cross hairs are triangulated to the same location in all images highlighting the lateral free wall of the myocardium.

