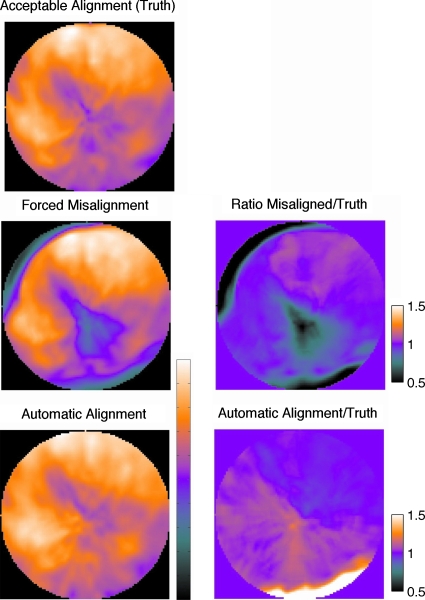
Figure 8.
Polar maps for a patient combination 7, showing the AC PET data with originally aligned map, after forced misalignment (row 2), and after proposed alignment (row 3). Ratio maps in the second column show that forced misalignment causes a clear AC artifact. This study had the most realignment error (RMSE of 10.8 mm) with the known transformation. The alignment resolved the apical and basal anteroseptal errors, but reversed the basal inferior error.

