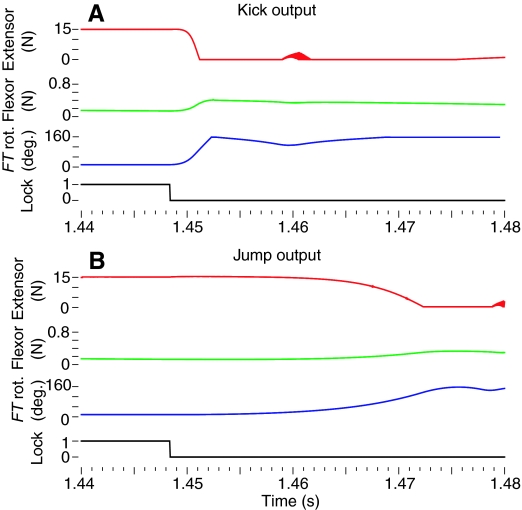
Fig. 4.
Expanded view of jump or kick data. Kick data from Fig. 3 is expanded and compared with data from a jump. The output of the motor program was the same for both the kick and the jump, and so was omitted here. Each chart shows the tension in the extensor and flexor muscle of the left metathoracic leg, the rotation of the femur–tibia (FT) joint and the status of the tendon lock. (A) To produce a kick, the tibia began to rotate very rapidly after the tendon lock was disabled, and completed full extension in 4.1 ms. (B) The jump used the same motor program but the leg rotated more slowly because the tibia was loaded, and so reached its maximum value after 28.35 ms. The colored plot lines have the same colors as the corresponding lines for plots of the same variables in Fig. 3.

