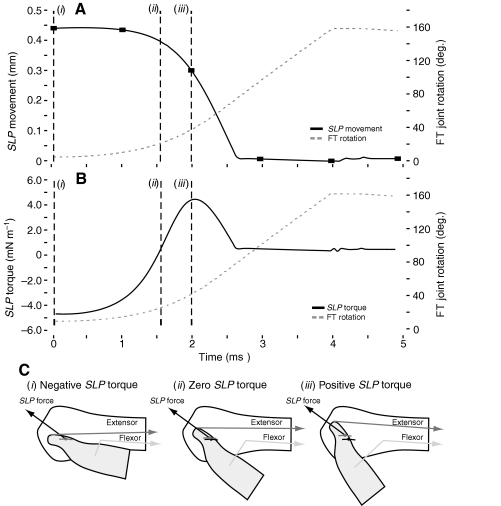
Fig. 8.
Semi-lunar process (SLP) movement and torque during a kick. Prior to the kick, the tibia was flexed, the extensor tension was 15 N, SLP torque was −4.7 mN m−1, and the SLP strain was nearly 4.5 mm. (A) The femur–tibia (FT) joint rotated with a maximum velocity of 63 deg. m s−1 and reached full extension of 160 deg. in 4 ms (broken gray line, right axis). The SLP strain decreased quickly during the kick (black line, left axis). The filled black squares represent the SLP positions at 1 ms time intervals when a high-speed camera at 1000 frames s−1 would take images [compare with fig. 3B of Burrows and Morris (Burrows and Morris, 2001)]. The beginning of the kick is shown with the broken vertical line (i). The first point where a noticeable decrease in the SLP would be visible at 1000 frames s−1 is shown with the broken vertical line (iii), which corresponds to a FT rotation of 38.12 deg. (B) SLP torque around the extensor attachment point (black line, left axis) was initially negative, which helped to maintain leg flexion. Significant SLP movement and leg extension occurred after the torque became positive, at broken vertical line (ii). (C) Negative SLP torque occurred when the force applied by the SLP caused torques that retarded tibia rotation (i), while positive torque enhanced tibia rotation. Positive torque only occurred after the leg had rotated enough to move the extensor attachment point to the opposite side of the SLP force vector (iii). Light gray hinge joint is the position of the FT joint at that time, while the black hinge is the position of the FT joint at the beginning of the kick. Figures in part C are for illustrative purposes only and are not drawn to scale.

