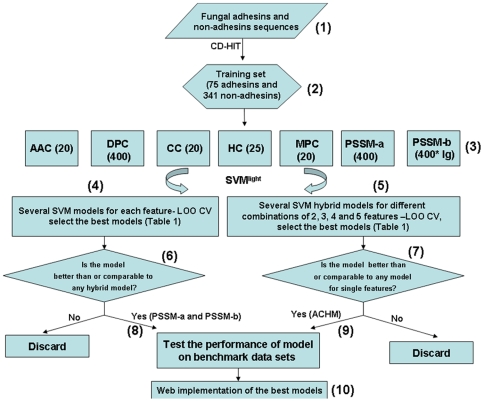
Figure 1. Flowchart of the experimental procedures.
(1) A pool of fungal adhesins and non-adhesins sequences was generated from sequence and bibliographic databases (GenBank, UniProt, PubMed). (2) Using CD-HIT, the redundancy of the sequences from both the sets was scaled to 50% threshold, yielding 75 adhesins (positive set) and 341 non-adhesins (negative set). (3) Seven different features of different dimensions (mentioned inside brackets) were extracted using PERL scripts for both the sets. For PSSM-b, lg means lag, i.e. distance along the sequence, for details c.f. [35] (4) LOO CV was done on each of the features and several SVM models with different C and γ generated. The models giving good accuracies and almost equal sensitivity and specificity were selected. (5) Several different combinations of 2, 3, 4 and 5 features were made and LOO CV run on these. Here also the best ones were selected. (6) If the performance of the seven best models trained on different individual features was comparable to or better than the best hybrid models, it was selected for further evaluation. Here the models PSSM-a and PSSM-b were selected. (7) If the hybrid model provided an edge over its constituent individual features or the other hybrid models (in terms of accuracy), it was selected (ACHM) for further evaluation. ACM was another best model amongst the hybrids but offered lower accuracy than ACHM, so was not considered further. (8) & (9) The best SVM models were tested on benchmark data sets. (10) The PSSM-a and ACHM models were implemented on the web server.

