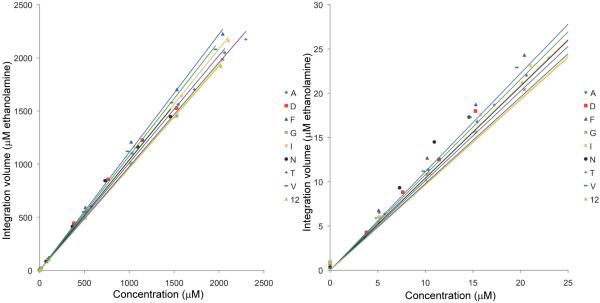
Figure 3.
Calibration curves for 9 standard amino compounds detected by 1H-13C HSQC after 13C-formylation, with an expanded view of 0-25 μM concentration range shown in the right panel. The 2D peaks were integrated and referenced to the integration volume of 13C-formylated ethanolamine (internal standard) and plotted against the concentrations previously determined by 1D 1H NMR. The integration volume of 13C-formylated 1 μM ethanolamine serves as the unit for the vertical axis. The trend lines were generated by linear regression; R2 values were greater than 0.995 for all 9 compounds; Good quantitation was observed: the average deviation from the calibration trend line is 6% for concentrations above 10 μM and 12% for concentrations below 10 μM.

