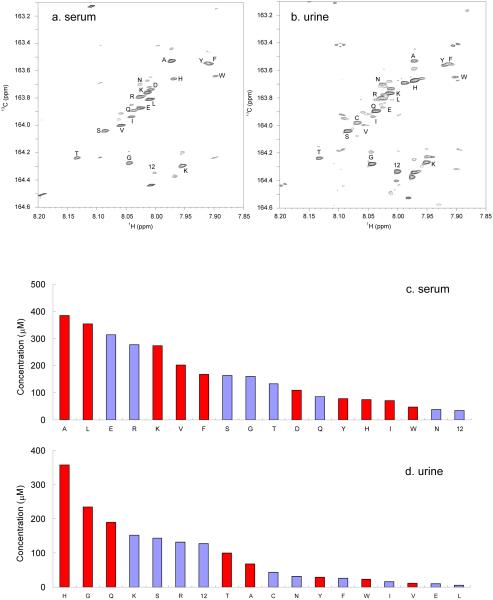
Figure 4.
1H-13C HSQC spectra of a healthy human serum sample (a) and a healthy human urine sample (b) after 13C-isotopic tagging with 13C-formic acid. Eighteen metabolites were indentified and quantified in each spectrum. Concentrations for amino metabolites identified and quantified using the 2D 1H-13C HSQC spectra for the serum sample (c) and the urine sample (d) after 13C-formylation. Metabolites that have resolved 1D 1H signals are marked in red and others are marked in light blue.

