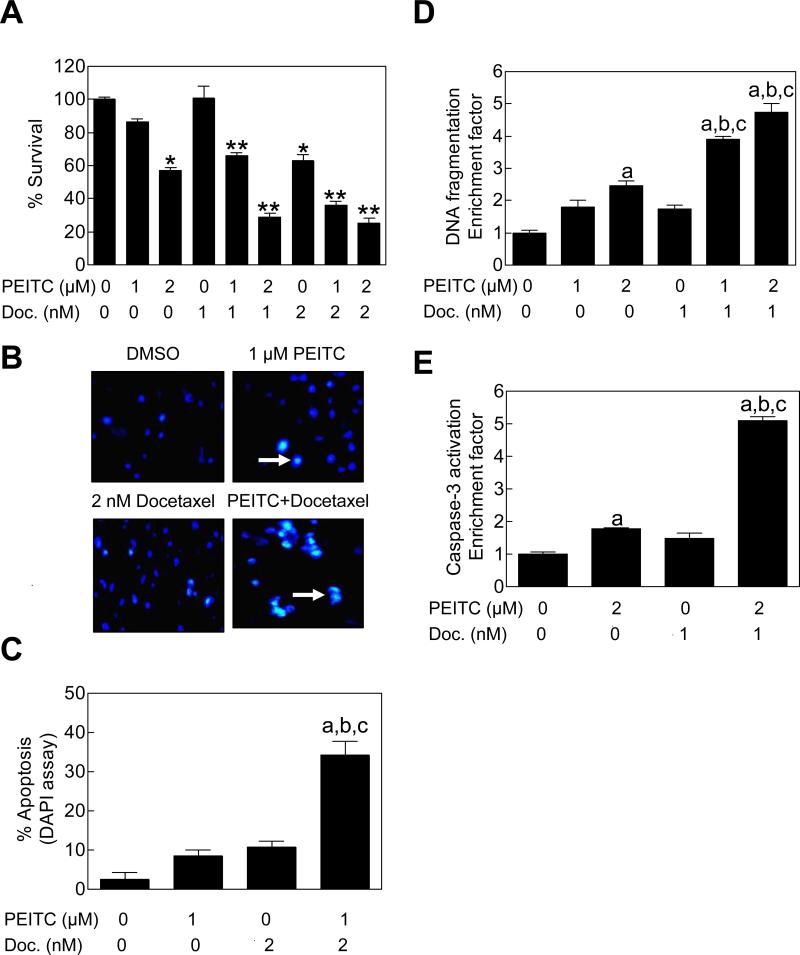
Figure 1.
PEITC sensitized PC-3 cells to growth inhibition and apoptosis induction by Docetaxel. A, Survival (trypan blue dye exclusion assay) of PC-3 cells following 24 h treatment with DMSO (control) or the indicated concentrations of PEITC and/or Docetaxel. Results shown are mean ± SE (n= 3). Significantly different (P<0.05) compared with *DMSO-treated control; and **corresponding PEITC alone as well as Docetaxel alone group. B, Visualization of apoptotic cells (identified by arrows) by DAPI staining (40× magnification) in PC-3 cells treated for 24 h with DMSO (control) or the indicated concentrations of PEITC and/or Docetaxel. C, Quantitation of apoptotic cells (DAPI assay) following 24 h treatment with the indicated concentrations of PEITC and/or Docetaxel. D, Analysis of cytoplasmic histone-associated DNA fragmentation, and E, analysis of caspase-3 activation in PC-3 cells treated for 24 h with the indicated concentrations of PEITC and/or Docetaxel. In panels C-E, results shown are mean ± SE (n= 3-4). Significantly different (P<0.05) compared with aDMSO-treated control, bPEITC alone, and cDocetaxel alone by one-way ANOVA followed by Bonferroni's or Tukey's test.

