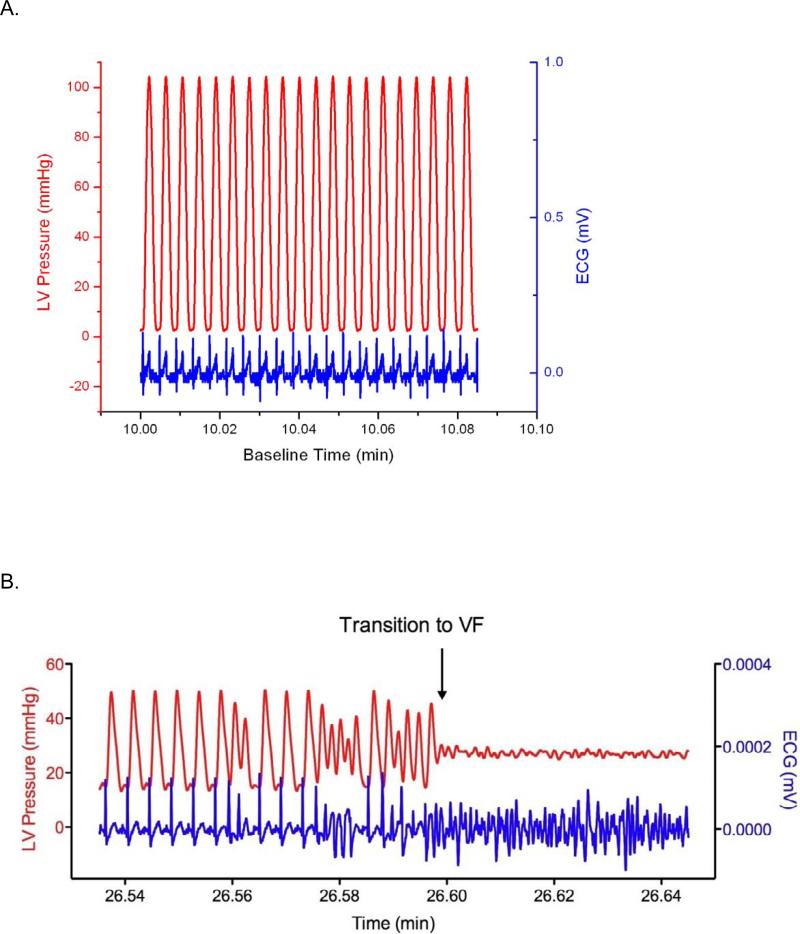
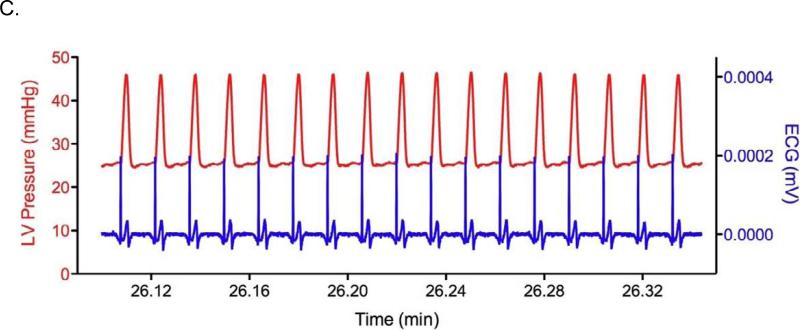
Figure 2.
Representative LV Pressure and ECG from hearts in the study. A. Control heart after 10 minutes of baseline perfusion with simultaneous LV Pressure (red) and ECG (blue). B. LV Pressure and ECG in a heart 6 minutes into the washout period following the diamide treatment showing the transition to VF (blue) with concomitant loss of pump function (red). C. LV Pressure and ECG in a heart 6 minutes into the washout period following diamide treatment plus 64μM 4-ClDzp.


