Figure 6.
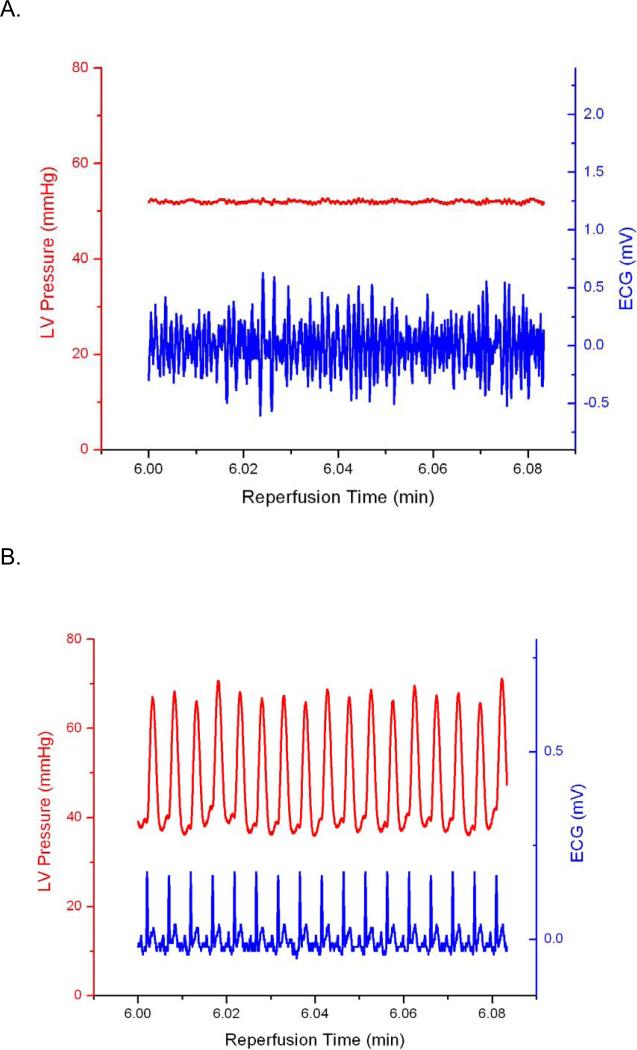
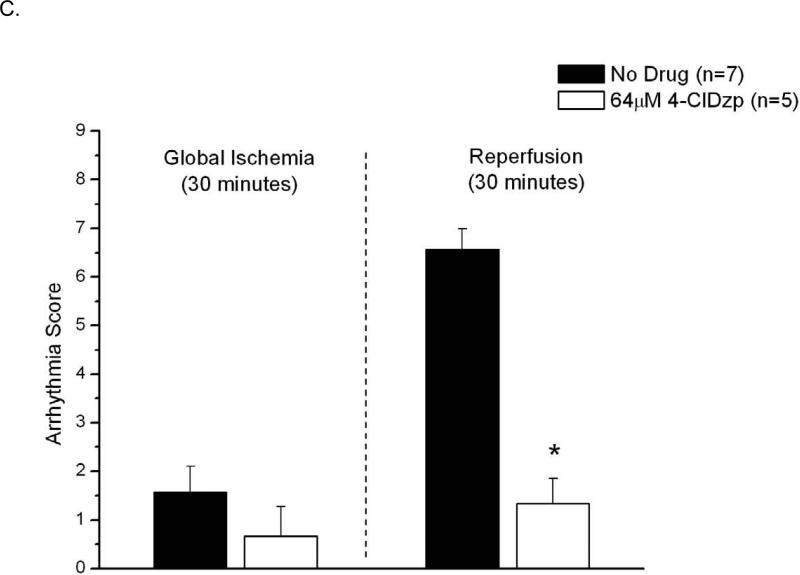
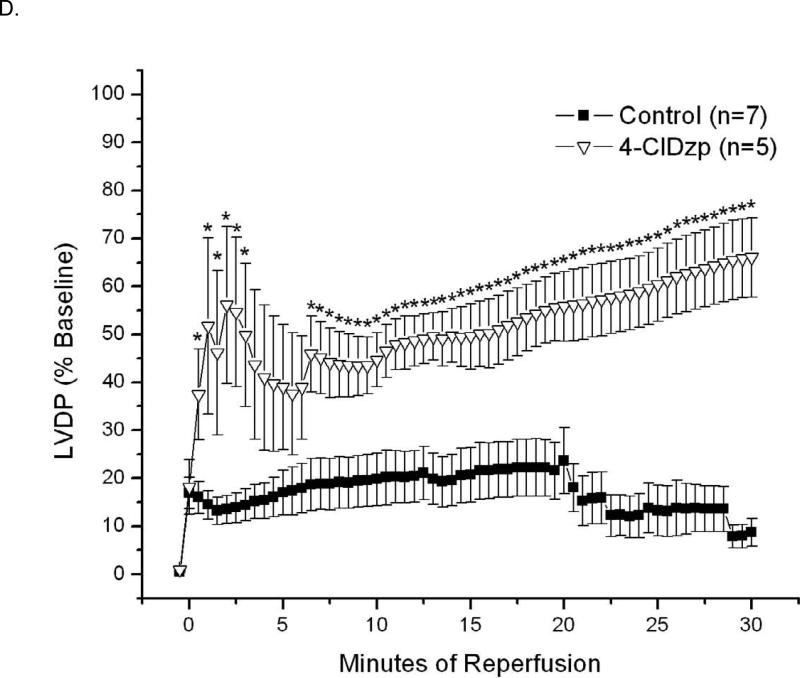
Data from hearts exposed to 30/30 min of ischemia/reperfusion. Representative LV Pressure (red) and ECG (blue) traces for control (A) and 4-ClDzp-treated (B) hearts. C. Arrhythmia scores for hearts exposed to ischemia and reperfusion in the absence or presence of 64μM 4-ClDzp. D. LV Developed Pressure for hearts after 30 minutes of global ischemia.


