
Figure 2.
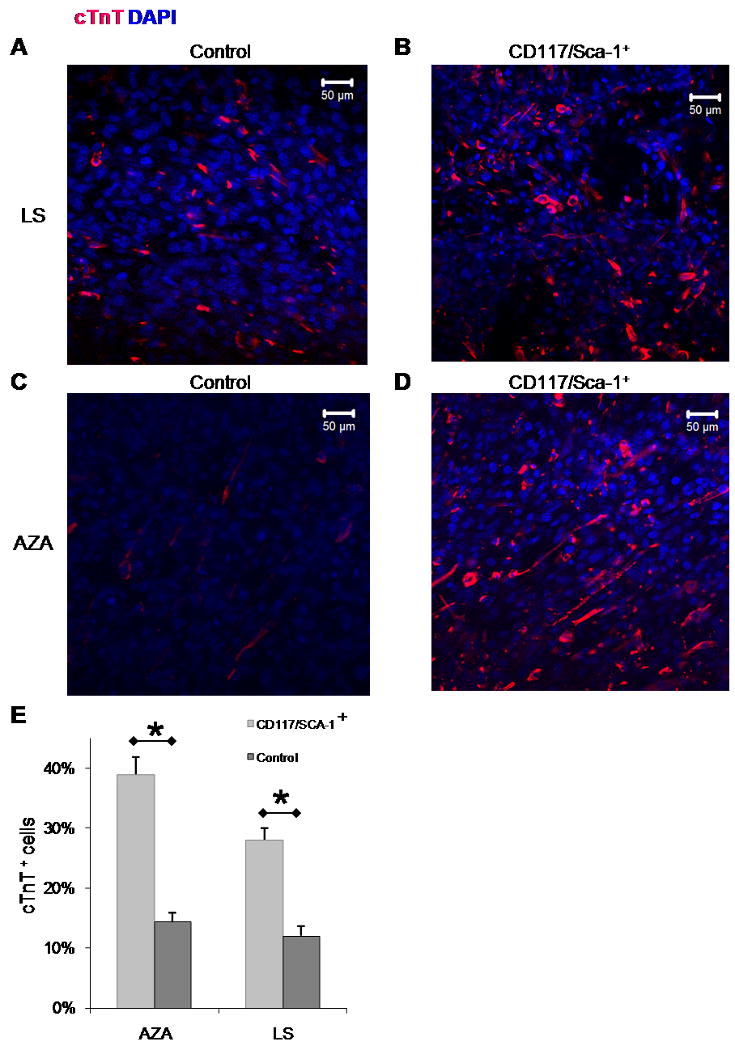
Immunofluorescence from cTnT stained IP CD117/Sca-1 enriched cells compared to IP unenriched (control) cells cultured for up to 21 days: A. cTnT staining of control cells treated with LS. B. cTnT staining of CD117/Sca-1+ cells treated with LS. C. cTnT staining of control cells treated with AZA. D. cTnT staining of CD117/Sca-1+ cells treated with AZA. E. Mean cTnT positive cells for enriched and control fractions cultured in AZA or LS. The number of sampled fields, n, from left to right was 31, 53, 33, and 46 respectively. Values represent mean ± SEM, and significant differences (*) are P<0.05. There was no significant difference between the two enriched groups treated with AZA or LS.