
Figure 4.
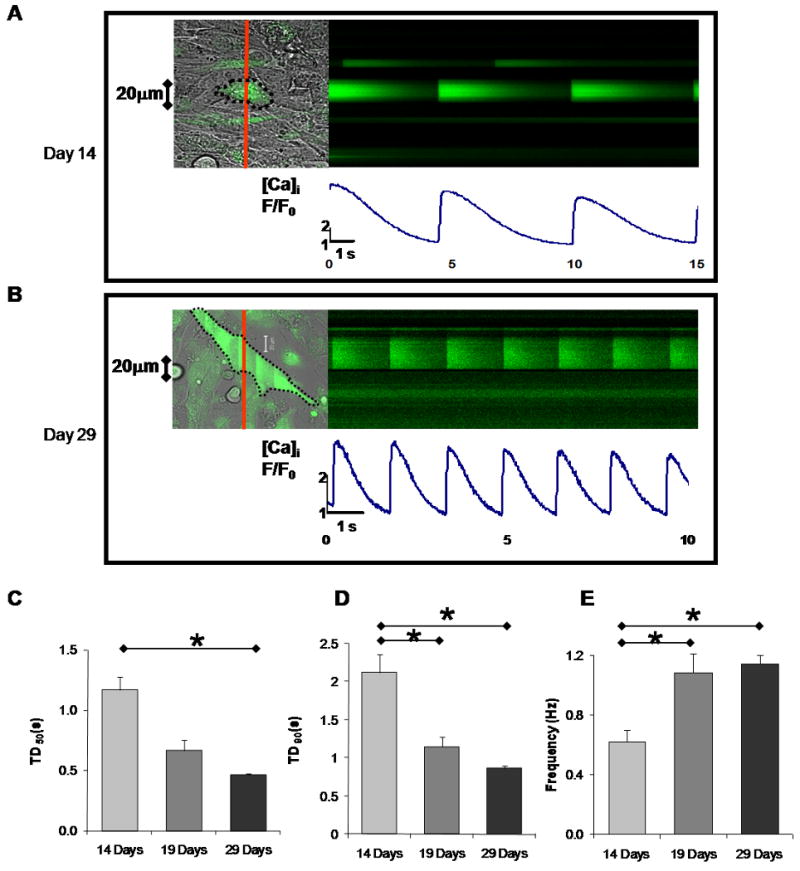
Confocal line scan images of IP CD117/Sca-1+ cells loaded with Fluo-4/AM showing spontaneous intracellular Ca2+ transients: A. Representative Ca2+ cycling by Day 14 of culture. B. Representative Ca2+ cycling by Day 29. See also supplemental Video-1. C-E. Intracellular Ca2+ transients of spontaneously cycling cells at Day 14, 19, and 29 in LS differentiating media: (C) Transient duration at 50% amplitude (TD50). (D) Transient duration at 90% amplitude (TD90). (E) Mean Ca2+ transient frequency. The number of cells and the corresponding cycles analyzed were (10, 42), (7, 27), and (9, 76) for days 14, 19, and 29 respectively. Values represent mean + SEM and significant differences (*) are p<0.05.