
Figure 1.
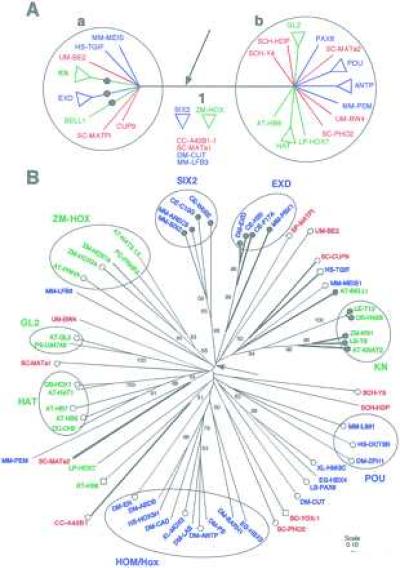
(A) Phylogenetic relationships between eukaryotic homeodomain protein sequences indicate an ancient duplication that occurred before the origin of angiosperms, metazoa, and fungi. Homeodomain proteins are divided into two groups, a and b, each containing well supported subgroups from all three kingdoms: angiospermae (green), fungi (red), and metazoan (blue). This tree is a consensus of results from different phylogenetic analyses of a dataset of 60 sequences from which a 3-aa insertion/deletion site was removed. The strict consensus of 59 trees was obtained after removing 14 sequences including subgroups ZM-HOX and SIX2. These 14 sequences occupy variable positions on the tree in all analyses. Results are presented as unrooted trees, because no outgroup sequence is known. Similar results were obtained from neighbor-joining analyses of larger datasets. All sequences in group a have a 3-aa insertion (arrow) in the homeodomain. Several sequences in group a share an amphipathic helical secondary structure in the region N terminal to the homeodomain (•). (B) The distributions of two protein characteristics are consistent with the phylogenetic tree based on primary sequence data. This tree was obtained from neighbor-joining analyses of pairwise p-distances. Strongly supported angiosperm protein subgroups (green) are associated with fungal (red) and metazoan (blue) subgroups. Sequence names are indicated as follows: the first two letters represent the Latin name and are followed by the name of the gene. Angiospermae: AT, Arabidopsis thaliana; DC, Daucus carota; LE, Lycopersicon esculentum; LP, Lycopersicon peruvianum; OS, Oryza sativa; PS, Phalaenopsis sp.; PC, Petroselinium crispum; ZM, Zea mays. Metazoa: CE, Caenorhabditis elegans; DM, Drosophila melanogaster; EG, Echinococcus granulosus; HS, Homo sapiens; LS, Lineus sanguineus; MM, Mus musculus; XL, Xenopus laevis. Fungi: SC, Saccharomyces cerevisiae; SCH, Schizophyllum commune; UM, Ustilago maydis. Branches are drawn proportional to p-distance. The scale represents p-distance. Numbers along each branch indicate bootstrap values over 50%. Most internal branches have low statistical support. Branch 1 derives support from evidence external to primary sequence data. Presence of three amino acids in the insertion/deletion (thick branches) marks most of the sequences in group a. The SIX2 subgroup is assumed to have lost three amino acids on this tree, but not in other trees where its phylogenetic position is outside of group a. The phylogenetic distribution of the amphipathic helix in the N terminal region (•), its absence (○), and a short N terminal region (□) indicates that the N terminal structure characterizes sequences in group a.