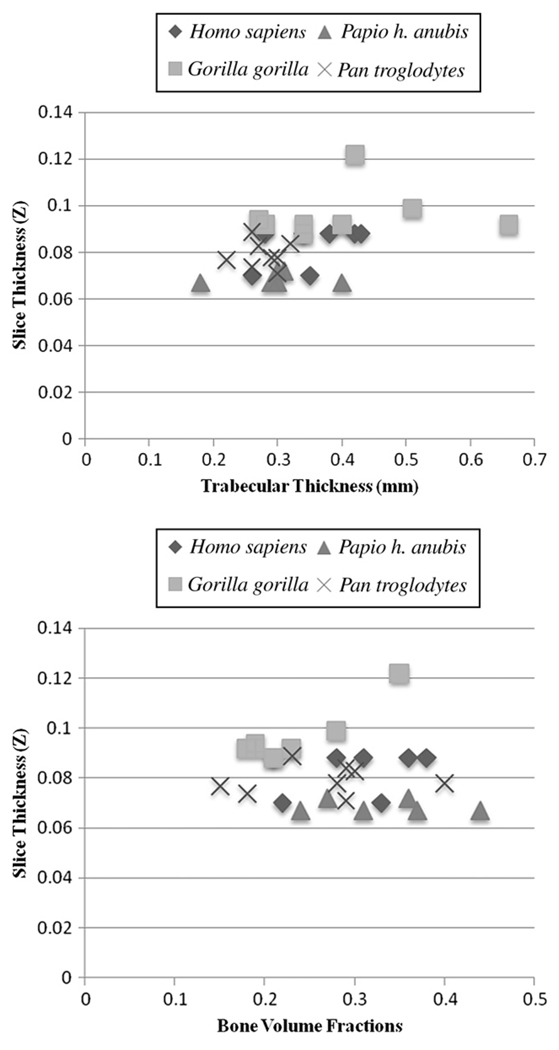
Fig. 5.
Graphs plotting trabecular thickness (top) and bone volume fractions (bottom) against slice thickness. Bone volume fractions (r = 0.191, p = 0.312) and anisotropy (data not shown; r = 0.337, p = 0.068) do not significantly increase with larger slice thicknesses. Regression analyses indicate that trabecular thickness significantly increases with slice thickness (r = 0.468, p = 0.009). Removal of Gorilla from the regression shows that the association is no longer significant (r = 0.379, p = 0.082).

