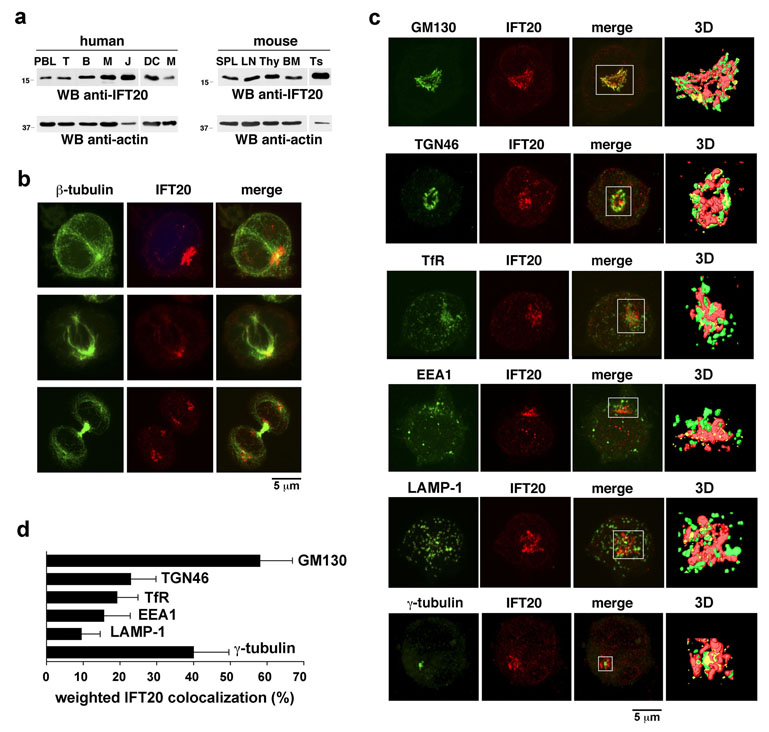
Figure 1. IFT20 is expressed in T cells and associates with Golgi apparatus and MTOC.
a. Immunoblot analysis of IFT20 in lysates of human and murine lymphoid and myeloid cells. PBL, peripheral blood lymphocytes; T, T-cells; B, B-cells; M, monocytes; J, Jurkat cells; DC, dendritic cells; SPL, spleen; LN, lymph node; Thy, thymus; BM, bone marrow; Ts, testis (positive control). b,c. Immunofluorescence analysis of IFT20 localization in Jurkat cells costained with antibodies against (b) β-tubulin or (c) γ-tubulin or markers of membrane compartments. Panel b shows cells in interphase (top), metaphase (middle) and telophase (bottom). In panel c, GM130, cis-Golgi; TGN46, trans-Golgi network; TfR, recycling endosomes; EEA1, early endosomes; LAMP-1, lysosomes. Z-stack projections are shown. The white box in the merge images represents the field of view for the 3D reconstructions based on sequential 0.5 µm sections shown on the last panel of each row. The corresponding animations are shown in the supplemental online information (Movie 1–Movie 6). d. Quantification of the weighted colocalization (as percentage) of the different subcellular organelles/compartments with the IFT20 staining (mean ±SD). 30 cells were analyzed for each marker. All of the pairwise comparisons of the IFT20 colocalisions with the GM130, TGN46, TfR, EEA1, LAMP-1 and γ-tubulin were statistically significant (p<0.01 at least) with only two exceptions being: TGN46 vs TfR and TfR vs EEA1.

