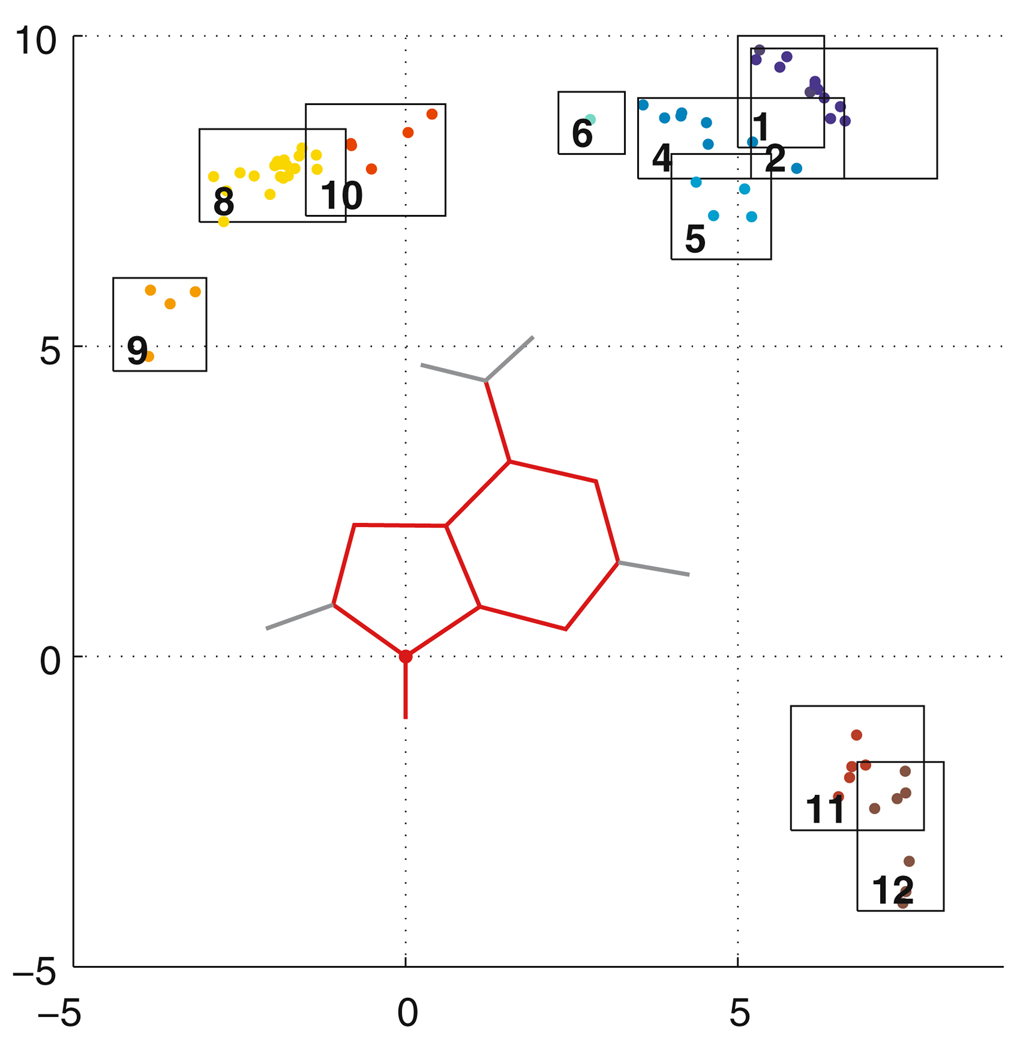
Fig. 2.
Relative location in 65 AA basepairs extracted from PDB files 1s72 and 1j5e by the classification module. Each pair is rigidly translated and rotated so that the first A coincides with the A at the origin; the glycosidic nitrogen of the second A is shown as a colored dot. Each of the basepairing categories is colored with a different color. Boxes indicate cutoffs for each category. The axes are marked in Ångstroms

