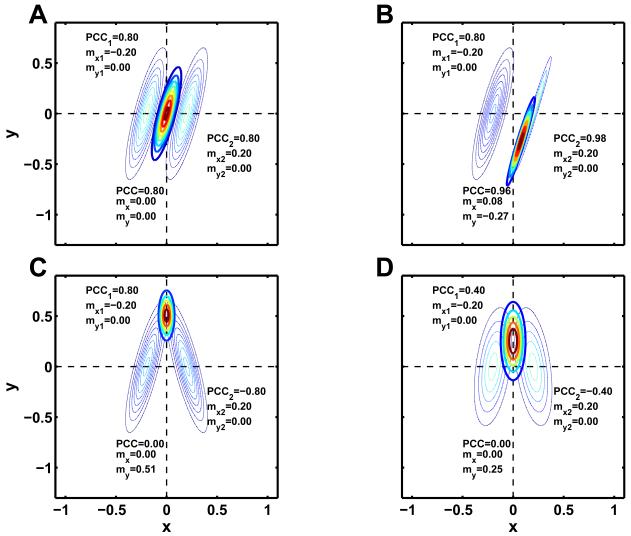
Fig. 1.
Product of two Gaussians: Shown are contour plots of two bivariate Gaussian distributions (thin lines) and the resulting product (bold lines). In all four plots both distributions have zero mean in y and +/−0.2 in x-direction and a variance of 0.1 in y and 0.01 in x. In (A), (B) and (C) the left Gaussian is kept constant with a PCC=0.8 whereas the right Gaussian has a PCC of 0.8, 0.98 and −0.8 respectively. (D) shows the same data as (C) with a lower PCC of +/−0.4. The resulting PCC and the mean in x and y direction are also shown. Dashed lines mark the arithmetic mean as recovered in RFX analysis.

