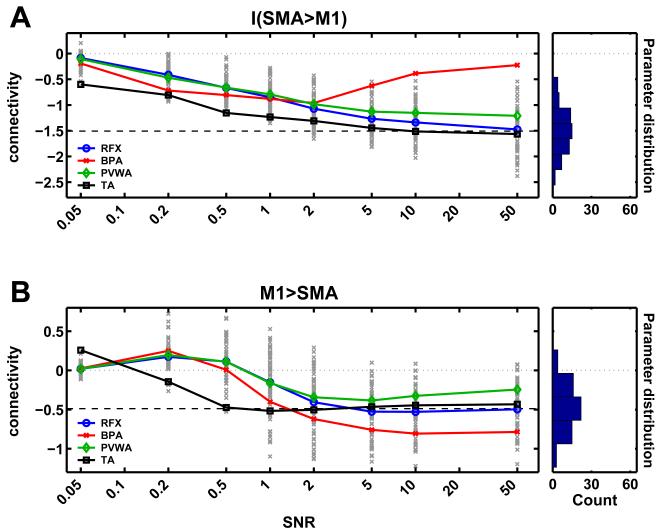
Fig. 4.
Single parameter comparison: (A) Estimation of a single parameter (modulatory influence of motor imagery on the connection SMA → M1) as a function of the SNR. Coloured solid lines represent different averaging methods (colour scheme as in fig. 3). Single-subject MAPs for a given SNR are marked by “x”. The box on the right side shows the true model parameters distribution. The dashed black line marks the mean of the model parameter. (B) Analogous results for the feedback connection from M1 to SMA.

