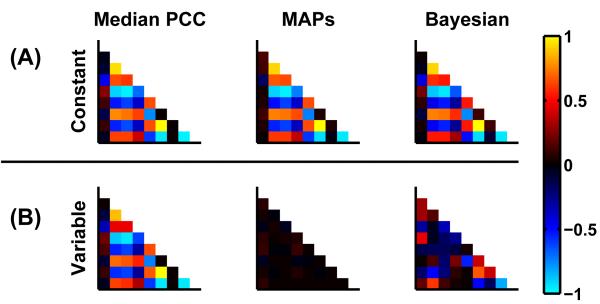
Fig. 6.
Group correlations calculated by different methods (left to right): (i) median posterior correlations across subjects, (ii) correlation of MAPs and (iii) BPA. The upper row (A) depicts the case of the homogeneous population whereas the lower row (B) represents the heterogeneous population. The results for SNR=50 are shown. Rows and columns of each matrix are in the same order as in fig. 5.

