Figure 3.
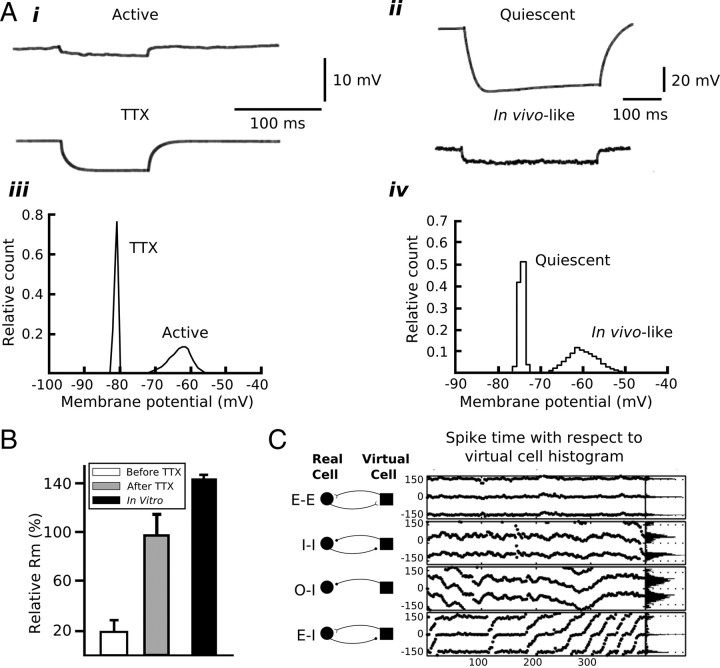
Artificial synaptic conductances introduced via dynamic clamp can be used to simulate in vivo-like conditions. A, Examples of raw traces of membrane voltage (i, ii) and histograms of membrane voltage distributions (iii, iv) during in vivo activity (i, iii) and in vivo-like conditions reproduced using artificial synaptic activity in vitro (ii, iv). Focal application of TTX near the site of recording in vivo increased the voltage deflection associated with an intracellular current step due to an increase in membrane input resistance caused by the cessation of synaptic activity (iii). Conversely, artificial synaptic activity introduced in vitro can reduce voltage deflections in response to a current step by reducing membrane input resistance (ii). Additionally, membrane voltage distributions are wider under in vivo (active) and in vivo-like conditions due to synaptic activity (iii, iv). B, Membrane input resistance is reduced significantly in vivo due to synaptic activity. The bar graphs quantify the relative membrane input resistance (Rm) under in vivo, in vivo with focal application of TTX, and in vitro conditions. Application of TTX in vivo eliminates synaptic activity and increases Rm to values approximating those measured in vitro. C, Spike time differences between a medial entorhinal cortical stellate cell and an artificial cell simulated using dynamic clamp. Stellate and artificial cells were connected via virtual synapses constructed in dynamic clamp and DC-driving currents were adjusted to generate spike times at 100 ms intervals. The following synaptic connection patterns were used: mutual excitation (E–E); mutual inhibition (I–I); periodic inhibitory drive from the artificial cell with no feedback from stellate cell (0–I); and excitatory drive from the stellate cell with inhibition from the artificial cell (E–I). In the middle section of C, the spike time differences are plotted against the spike number. The zero-crossing on the y-axis indicates the firing time of the artificial neuron; points represent the relative firing times of the stellate cell to the artificial cell. Spike time values <0 ms indicate that the spike in the stellate cell preceded that in the artificial cell. In the right-most section of C, histograms of the spike time differences are plotted. A was adapted with permission from Destexhe and Paré (1999) and Destexhe et al. (2001). B was adapted with permission from Destexhe et al. (2003). C was adapted with permission from Netoff et al. (2005).

