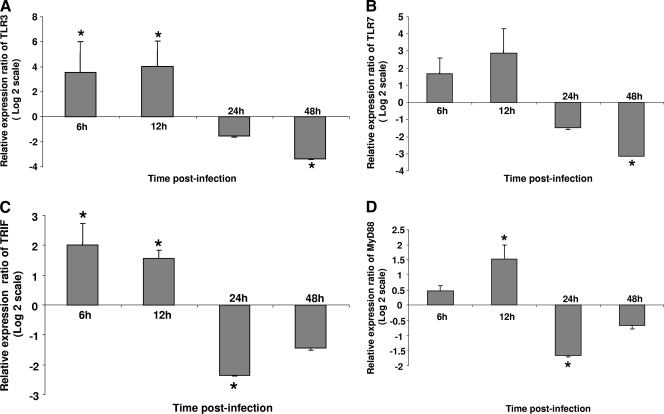
FIG. 3.
Relative expression ratio of TLRs and TLR adaptors in infected and mock-treated CEF cells. The expression of TLR3 (A), TLR7 (B), TRIF (C), and MyD88 (D) in the mock-treated and TROVAC-AIV H5-infected cells in four biological replicates are illustrated. Target and reference gene expression in the cells were quantified by real-time RT-PCR and are presented as the expression ratio of target genes to reference genes. An asterisk indicates significant difference (P < 0.05). Error bars represent standard errors from the means.

