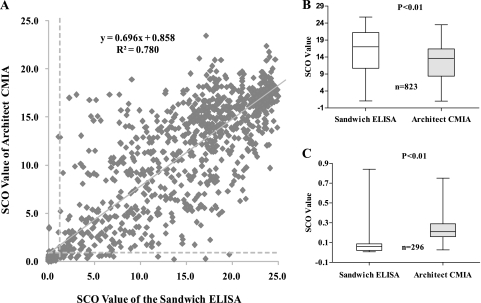
FIG. 5.
(A) Correlation between the Architect CMIA and sandwich ELISA in detection of anti-HBc from 1,148 samples. The y axis represents the SCO values measured by the Architect CMIA, and the x axis represents those measured by the sandwich ELISA. The broken lines indicate the lowest detection limit for each assay. (B) Comparison of SCO values between the sandwich ELISA and Architect anti-HBc CMIA in 823 concordant positive specimens; (C) comparison of SCO values between the Architect CMIA and the sandwich ELISA in detecting 296 concordant negative specimens.

