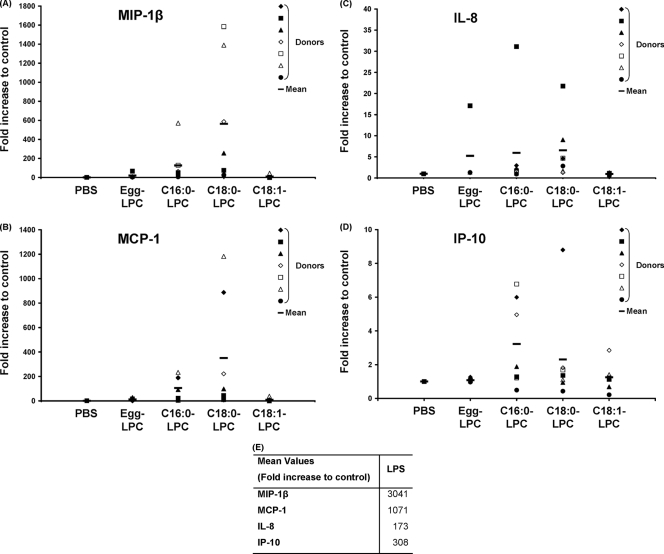
FIG. 3.
Chemokines secreted by MoDCs upon stimulation with various LPCs. The supernatants of MoDCs treated with LPC components or PBS (A to D) or with LPS (E) at day 5 for 24 h were collected, and the chemokine concentrations were measured by using the CBA technology. Raw data were normalized to the results for the control (PBS treated), which was arbitrarily set equal to 1. The data for each donor are plotted individually; data for a total of seven donors were assayed independently, and the mean for the donors is indicated by the thick horizontal lines. (A) MIP-1β; (B) MCP-1; (C) IL-8; (D) IP-10. The mean values obtained with LPS-treated cells are indicated separately (E).

