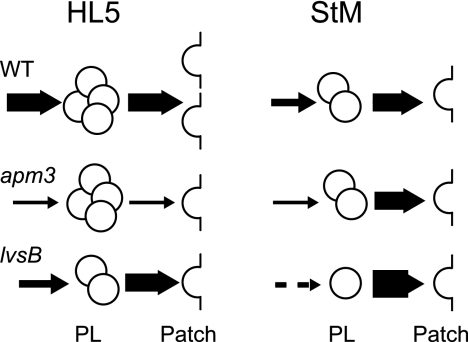
Fig. 5.
Schematic representation of wild-type, apm3, and lvsB cell phenotypes in HL5 and starvation medium (StM). For each condition, the numbers of PLs and exocytic patches represented are roughly proportional to those actually measured. The thickness of each arrow is proportional to the efficiency of PL biogenesis or exocytosis. The values for many parameters (e.g., number of exocytic patches and efficiency of fusion of PLs with the cell surface) vary depending on the conditions. The only defect seen in both starved and unstarved lvsB or apm3 mutant cells in comparison to wild-type cells is the slower biogenesis of postlysosomes, suggesting that it is at this stage of intracellular transport that both proteins are primarily involved.

