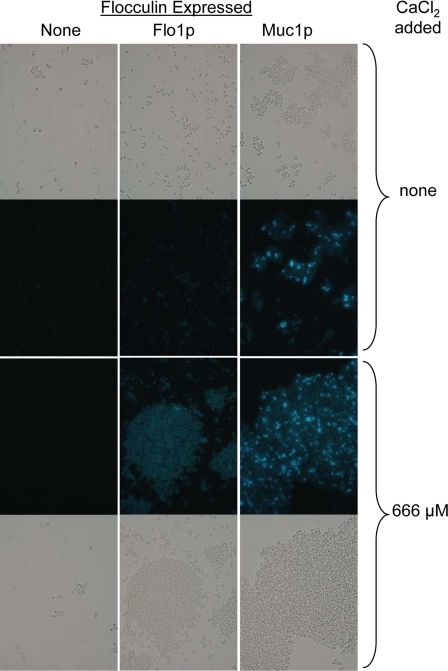
Fig. 5.
Thioflavin T staining of S. cerevisiae cells expressing ScFlo1p or ScMuc1p. Indicated strains were stained and visualized under bright-field (top and bottom rows), with matched fields for thioflavin T fluorescence in the middle two rows. Flocculation was induced with added Ca2+ for the images in the bottom two rows: left column, W303-1B; middle column, strain BX24-2B; right column, strain YIY345.

