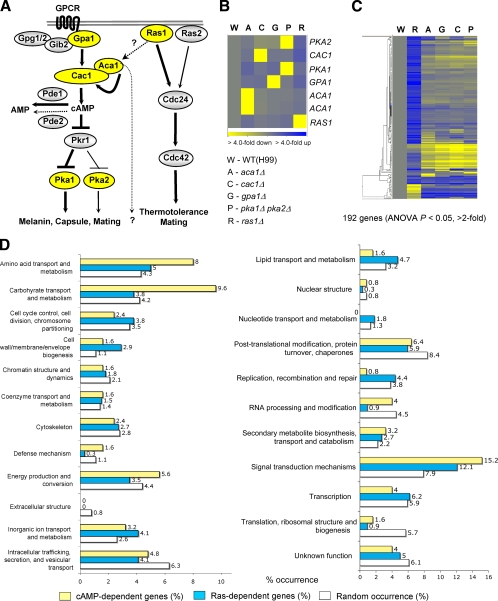
Fig. 1.
Genome-wide identification of genes regulated by the Ras and cAMP signaling pathways and their functional categories. (A) Schematic diagram summarizing the known signaling components of the Ras and cAMP signaling pathways in C. neoformans. (B and C) The degree of change (n-fold) in gene expression is illustrated by color coding (see the color bar scale at the bottom of the graph in panel B). (B) Relative expression levels of RAS1, ACA1, GPA1, CAC1, PKA1, and PKA2 genes in the ras1Δ (YSB51), aca1Δ (YSB6), gpa1Δ (YSB83), cac1Δ (YSB42), and pka1Δ pka2Δ (YSB200) mutant backgrounds compared to the WT strain (H99). (C) Hierarchical clustering analysis of 192 genes which are significantly up- or downregulated, by >2-fold (P < 0.05; ANOVA), in at least one of the mutant strains indicated in panel B. (D) Functional categories of genes differentially regulated by the Ras and cAMP pathways. Genes showing expression patterns in the ras1Δ (YSB51), aca1Δ (YSB6), gpa1Δ (YSB83), cac1Δ (YSB42), and pka1Δ pka2Δ (YSB200) mutants significantly different (P < 0.05; ANOVA) from those in the WT were functionally categorized based on KOG functional descriptions (http://www.ncbi.nlm.nih.gov/COG/). Bars indicate the following: yellow, percentages of cAMP-dependent genes; blue, percentages of Ras-dependent genes; white, random occurrence rates for genes in each KOG functional category in the whole C. neoformans genome.

