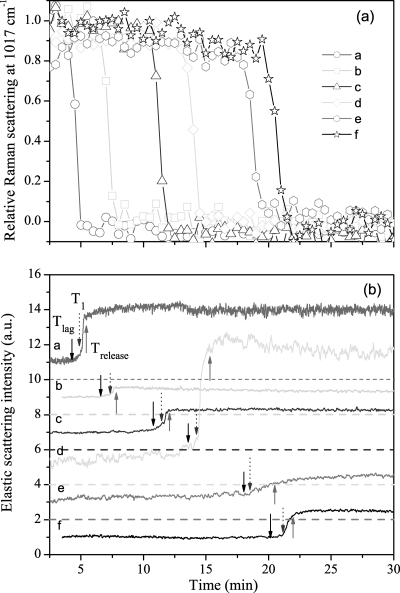
FIG. 7.
CaDPA release and ELS intensities for six individual B. subtilis PS533 spores during wet-heat treatment at 90°C. (a) Relative intensities of the Raman spectral band at 1,017 cm−1 for six individual spores (spores a to f) were determined as described in Materials and Methods. (b) Relative ELS intensities of the six spores described in the legend for panel a were determined as described in Materials and Methods. The baselines of ELS intensity were shifted for display, and the dashed line below each ELS signal is the corresponding zero level. The solid downward, solid upward, and dotted downward arrows mark Tlag, Trelease, and T1, respectively, for each spore.

