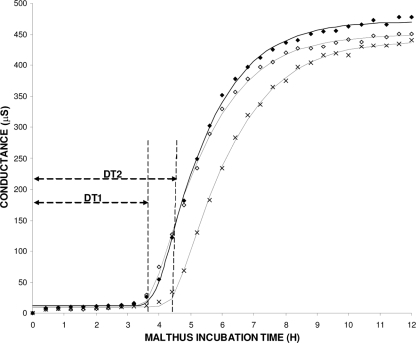
FIG. 2.
Typical changes for broth conductance (μS) versus time (h). Each Malthus tube contained an SS coupon which had previously been incubated for 12 h in growth medium containing 0% (⧫), 20% (⋄), or 50% (×) H. alvei CFS. Sigmoidal curves represent the fitting of the three data series with the model of Baranyi and Roberts (R2 > 0.99). The detection times (DTs; h) calculated by the model are also depicted. Similar DTs were recorded for 0 and 20% CFS (DT1); they were shorter than the DT recorded in the case of 50% CFS (DT2).

