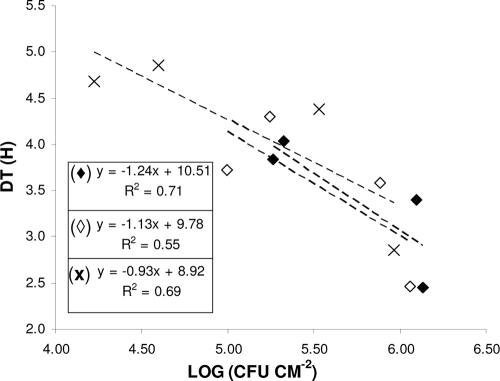
FIG. 3.
Linear regression plots between biofilm counts (log CFU cm−2) and corresponding conductance detection times (DTs; h). For biofilm formation, SS coupons were incubated at 18°C for up to 72 h in growth media containing 0% (⧫), 20% (⋄), or 50% (×) H. alvei CFS. Data points represent mean values. For greater clarity, error bars are not included. The mathematical equations of the three regression plots, together with their relevant regression coefficients (R2), are also shown.

