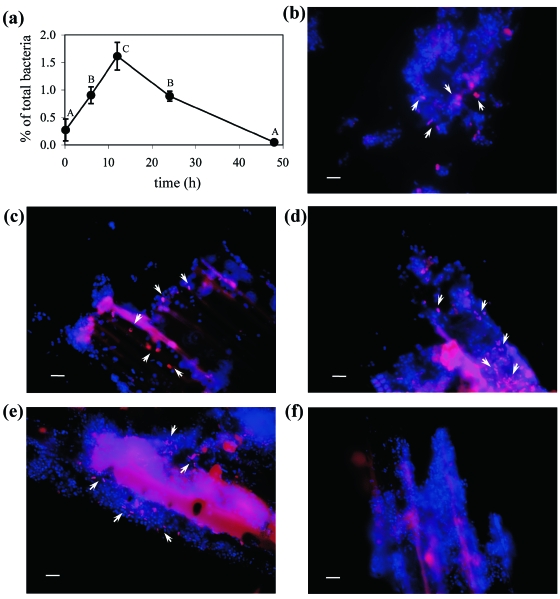
FIG. 2.
Molecular monitoring of group U2 associated with orchardgrass hay incubated in the rumen. (a) The time course of population size of group U2 was determined by real-time PCR from 10 min to 48 h of incubation. Error bars represent standard deviations for real-time PCR quantification of the samples from three sheep. A, B, and C on the graph indicate significant differences (P < 0.01) as determined by Student's t test. (b to f) Fluorescence images show FISH detection of group U2 cells after 10 min (b), 6 h (c), 12 h (d), 24 h (e), and 48 h (f) of ruminal incubation. In the FISH images, target cells were stained red (Cy3), while the other bacteria were stained blue (DAPI). Arrows indicate the target cells. Bars, 5 μm.

