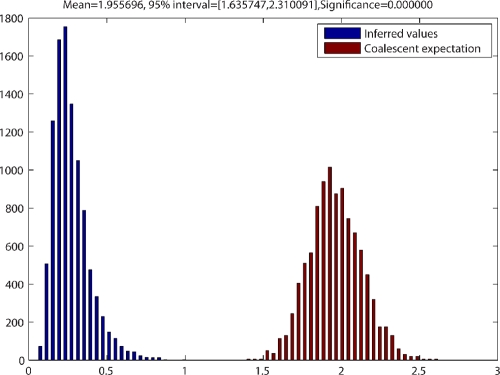
FIG. 2.
Distribution obtained by testing the external/internal branch length ratios of trees resulting from ClonalFrame analysis. Shown in blue is the distribution of the sum of the lengths of the external branches (connecting leaves of the tree) divided by the sum of the lengths of the internal branches (connecting internal nodes). Shown in red is the expected distribution of the external-to-internal branch length ratio under the coalescent model. The statistical significance of the deviation between the observed and expected ratios is shown at the top of the figure. The x axis represents the external/internal branch length ratio, and the y axis represents the tree sample frequency.

