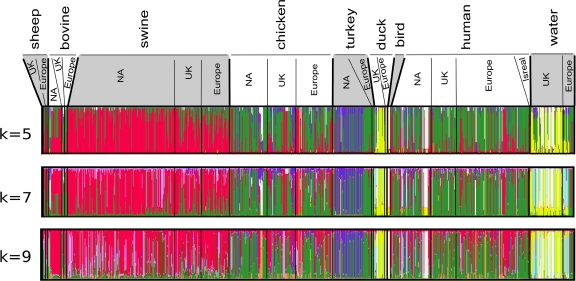
FIG. 3.
Genetic mixture of different C. coli host groups determined by STRUCTURE analysis. Results for 3 different values of K are presented, with a K value of 9 judged to be optimal. Geographic regions from which the isolates arise are indicated along the top. Each part of the figure consists of vertical bars, one for each isolate. Each bar shows the proportion of nucleotides inherited from different color-coded ancestral populations. NA, North America.

