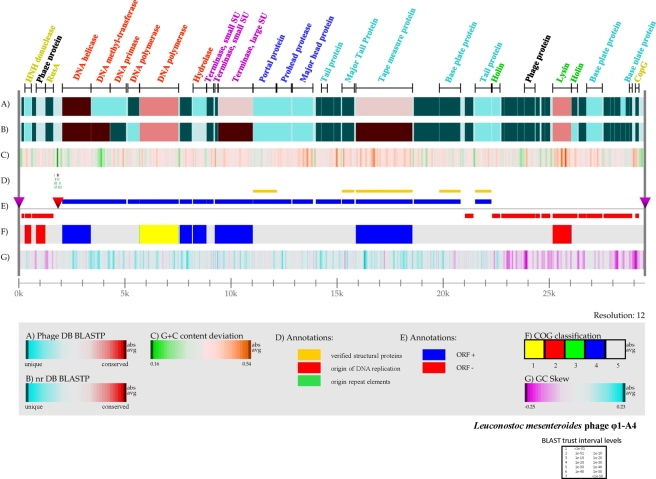
FIG. 2.
Genome atlas of phage Φ1-A4. The linear map was created using Genewiz, developed by Pederson et al. (60a; Center for Biological Sequence Analysis), and software developed in house. The legend at the bottom describes the individual panels corresponding to their respective designations (A to G). (A) Gapped BLASTP results obtained using the nonredundant database. (B) Gapped BLASTP results obtained using the custom phage genome database. In both panels A and B, blue regions represent unique proteins in Φ1-A4 and highly conserved features are red. The color intensity corresponds to the level of similarity. Individual E values were grouped into trust interval levels as depicted in the legend. (C) G+C content deviation: green shading, low-GC regions; orange shading, high-GC islands. (D) Annotation shows the absolute positions of functional features as indicated. (E) ORF orientation. ORFs in the sense orientation (ORF +) are blue; ORFs oriented in the antisense direction (ORF −) are red. The origin of DNA replication is indicated by a red inverted triangle. The cos site, depicting the phage genome boundaries, is indicated by two purple inverted triangles on the genome line (gray line). (F) COG classification. COG families were assembled into five major groups: 1, information storage and processing; 2, cellular processes and signaling; 3, metabolism; 4, poorly characterized; 5, ORFs with uncharacterized COGs or no COG assignment. (G) GC skew. ORFs with predicted functional annotation are shown at the top of panel A with bars indicating their absolute sizes. The color coding corresponds to predicted functional phage modules. Red, DNA replication; purple, DNA packaging; dark blue, phage head; sky blue, tail structure; green, lysis; greenish yellow, DNA regulation and modification; black, not assigned to a specific phage module.

