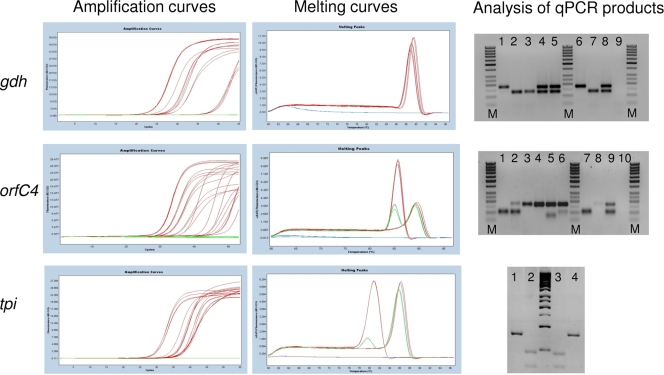
FIG. 1.
Schematic representation of the amplification curves (left), melting curves (middle), and electrophoretic separation of products (right) obtained using the gdh, orfC4, and tpi qPCR assays. In gel electrophoresis of gdh products, lane M is the 50-bp size ladder; lanes 1 and 6 show the assemblage A product (180 bp); lanes 2, 3, and 7 show the assemblage B product (133 bp); lanes 4, 5, and 8 show the presence of both assemblages A and B; and lane 9 shows the negative control. In gel electrophoresis of orfC4 products, lane M is the 50-bp size ladder; lanes 1 and 7 show the assemblage A product (103 bp); lanes 3, 4, 5, and 8 show the assemblage B product (171 bp); lanes 2, 6, and 9 show the presence of both assemblages A and B; and lane 10 shows the negative control. In gel electrophoresis of tpi amplicons, the product from assemblage A is not cut by AluI (lane 1) but is cut by HincII into two fragments of 47 bp and 31 bp (lane 2), whereas the B product is cut by AluI into two fragments of 45 bp and 32 bp (lane 3) but is not cut by HincII (lane 4).

