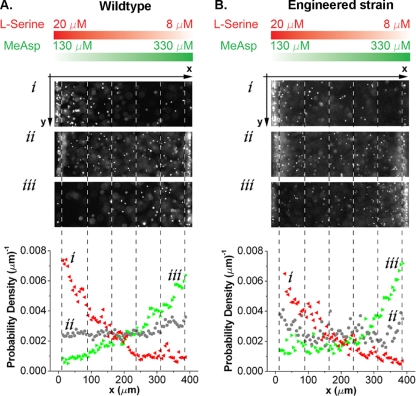
FIG. 2.
Responses of E. coli bacteria to two opposing chemoattractant gradients. The chemical concentration gradients of MeAsp (green) and serine (red) in the center channel are the same for both sets of experiments and are illustrated at the top. (A) Images of wild-type E. coli (RP437) cells, harvested at OD600 values of 0.26 (i), 0.53 (ii), and 0.65 (iii), in the center channel and their corresponding cell density profiles. (B) Images of RP4532 [Δ(tar-tap)] cells expressing various levels of Tar from plasmid pVS123 in the presence of native Tsr and their corresponding cell density profiles. Concentrations of the chemical inducer sodium salicylate for the expression of Tar were 0.06 μM (i), 0.15 μM (ii), and 0.4 μM (iii).

