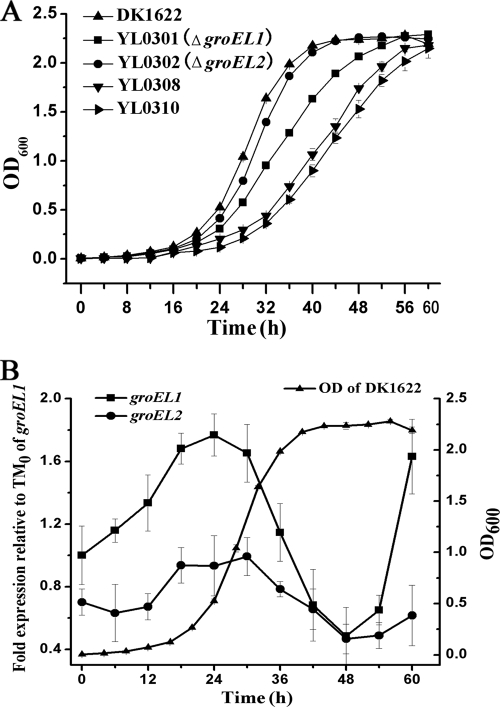
FIG. 1.
(A) Growth curves of the mutants with single deletions of either groEL1 or groEL2 or a double deletion of groEL1 and groEL2 and complementation with groEL1 (YL0308) or groEL2 (YL0310) and of the wild-type strain DK1622. (B) Quantitative PCR analysis of the expression levels of groEL1 and groEL2 of the wild-type strain DK1622 in CTT medium with an overlaid representative growth curve of the wild-type strain DK1622. The values are shown as levels relative to the expression of groEL1 at the onset of inoculation from a 36-h culture; the error bars represent standard deviations from three independent biological replicates. TM0, time zero.

