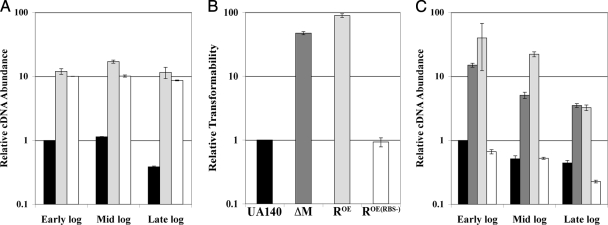
FIG. 4.
Analysis of the hdrR overexpression strain. (A) The expression of hdrR was measured by real-time RT-PCR during the early, mid, and late log phases, and results are presented relative to the early log phase transcript abundance of the wild type. Wild-type UA140 is represented by black bars, the translational fusion hdrR overexpression strain is represented by light gray bars, and the RBS-negative hdrR overexpression strain is represented by solid white bars. (B) Comparison of the transformation efficiencies of wild-type UA140 (black), the hdrM mutant (dark gray), the translational fusion hdrR overexpression strain (light gray), and the RBS-negative hdrR overexpression strain (white). Values are presented relative to the wild type, which was arbitrarily assigned a value of 1. (C) Comparison of the expression of comX among wild-type UA140 (black), the hdrM mutant (dark gray), the translational fusion hdrR overexpression strain (light gray), and the RBS-negative hdrR overexpression strain (white). Samples were measured by real-time RT-PCR during the early, mid, and late log phases, and results are presented relative to the early log phase transcript abundance of the wild type. The data in panels A to C are the average of three independent experiments. Each experiment measured three independent clones for each sample.

