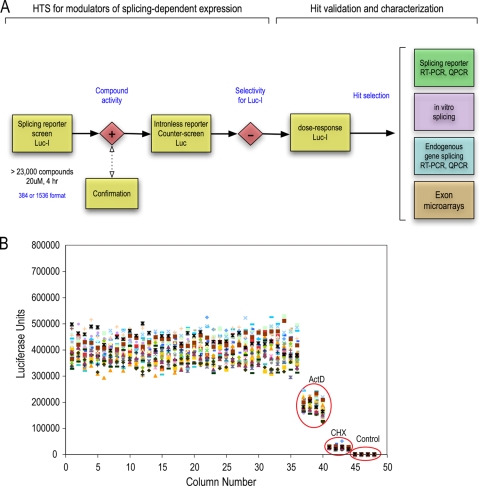
FIG. 2.
High-throughput screen for splicing modulators. (A) Workflow for HTS. Cells stably expressing Luc-I were screened with a collection of >23,000 compounds for 4 h (see Materials and Methods). Hits were counterscreened on Luc cells, and compounds that passed the selectivity step and showed a well-behaved dose response were further characterized as illustrated in the scheme. QPCR, quantitative PCR. (B) Scatter plot of a representative control plate of Luc-I cells in a 1,536-well format. Four columns on the plate were treated with ActD or CHX. The last four columns (Control) did not contain any cells and reflect the background/noise of the assay. The calculated Z′ value was 0.6, and the CV was 11%.

