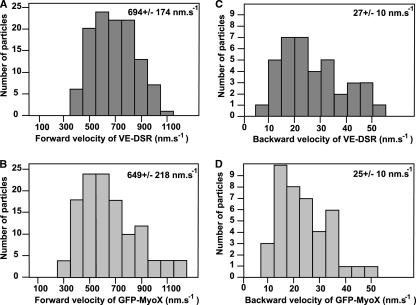
FIG. 11.
Velocity histograms for forward and backward movements of VE-DSR and GFP-MyoX patches. Histograms corresponding to the forward movements of VE-DSR (A) and GFP-MyoX (B) patches were generated from 115 and 129 measurements, respectively, while those corresponding to the backward movements of VE-DSR (C) and GFP-MyoX (D) patches were generated from 38 and 41 measurements, respectively. At the top right, the means ± standard deviations are indicated. HeLa cells were imaged at 25°C using a ×40 lens (NA, 1.35), a pixel size of 162 nm, and a frame rate ranging from 3 to 5 images s−1.

