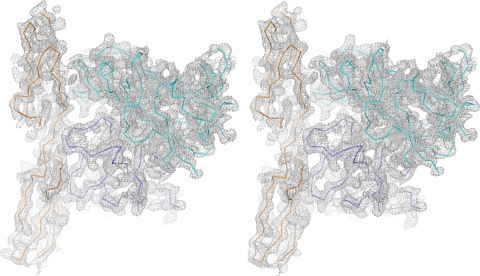
FIG. 1.
Electron density map for the Ad21 knob-CD46-D2 structure. Shown is the stereo view of the final, nonaveraged 2Fo-Fc electron density map for the Ad21 knob-CD46-D2 complex, contoured at 1.0 σ. Ribbon tracings for two Ad21 knob protomers (blue and cyan) and one CD46-D2 molecule (orange) are shown.

