FIG. 4.
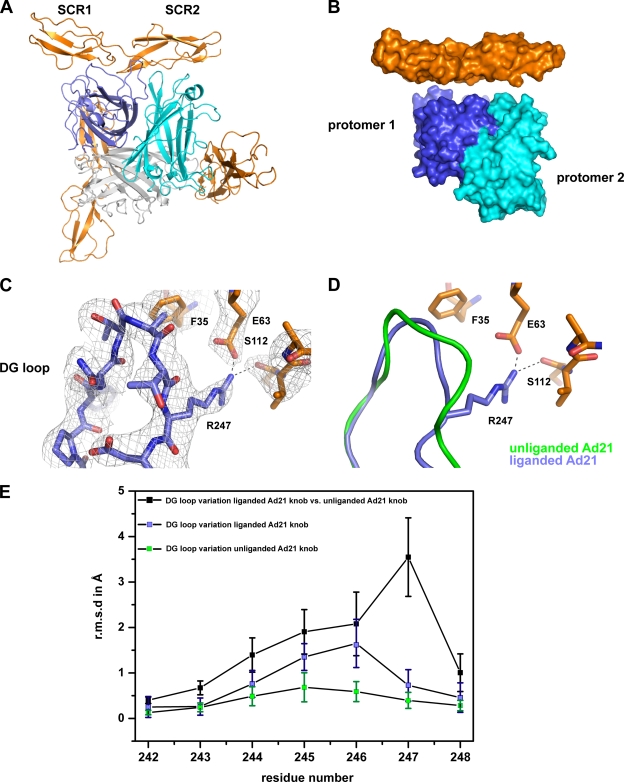
Structure of the Ad21 knob in complex with CD46-D2. (A) Ribbon drawing of the trimeric Ad21 knob in complex with three CD46-D2 molecules. The three protomers that form the knob are shown in blue, cyan, and gray, and the CD46-D2 ligands are shown in orange. One Ad21 knob-CD46-D2 interface is shown from the front, whereas two other Ad21 knob-CD46-D2 interfaces are shown from behind. (B) Surface representation of two Ad21 knob protomers (labeled protomer 1 and protomer 2) bound to one CD46-D2 ligand. The color code used is described above (A). (C) CD46-D2-bound Ad21 knob DG loop with the final nonaveraged 2Fo-Fc electron density map. (D) Superposition of the DG loop of the unliganded Ad21 knob (green) and the CD46-D2-bound Ad21 knob (blue). The relevant portion of CD46-D2 is shown in orange. The hydrogen bond and salt bridge are shown with dashed lines. (E) Comparison of DG loop conformations (residues 242 to 248) among unliganded Ad21 knob structures (green squares), among liganded Ad21 knob structures (blue squares), and between the liganded and unliganded structures (black squares). The average RMS deviation values for the Cα atoms of each residue are plotted as a function of the residue number. The bars show the standard deviations of the measured RMS deviation values for the Cα atoms.

