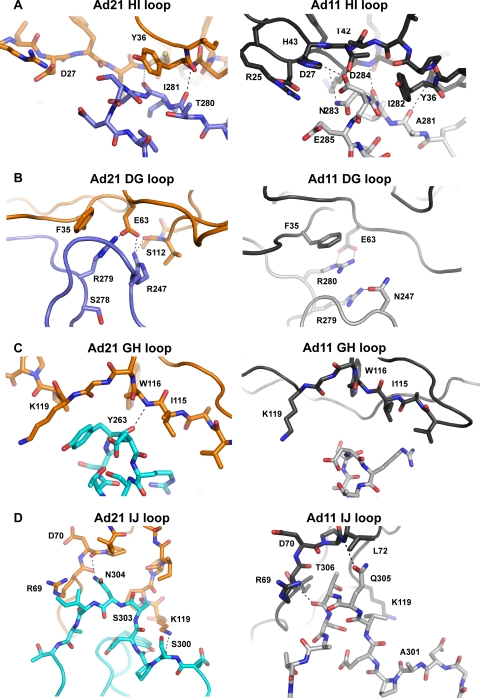
FIG. 6.
Comparison of interactions of CD46 with the Ad21 and Ad11 knobs. The close-up views show the four contact regions of the Ad21 knob-CD46-D2 interaction (centered at loops HI, DG, GH, and IJ, respectively) and compare them with the respective interactions in the Ad11 knob-CD46 complex. The color scheme is the same as that described in the legend of Fig. 5A. Hydrogen bonds and salt bridges are represented with dashed lines.

