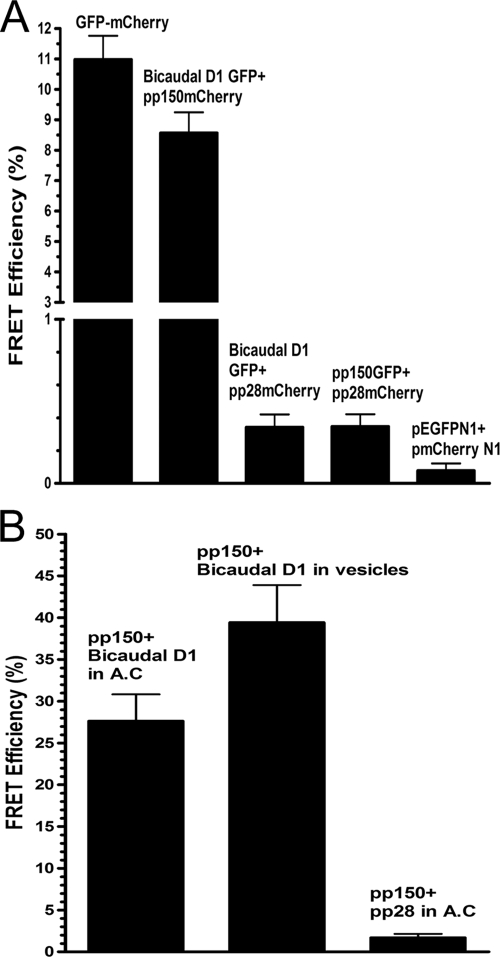
FIG. 4.
FRET analysis of pp150-BicD1 interaction. (A) COS-7 cells were transfected with plasmids expressing GFP-tagged Bicaudal D1 and mCherry-tagged pp150, GFP-tagged Bicaudal D1 and mCherry-tagged pp28 (negative control), GFP-tagged pp150 and mCherry-tagged pp28 (negative control), or pEGFPN1 and pmCherryN1 vectors (negative control) or with a plasmid expressing a GFP-mCherry fusion protein (positive control). The cells were harvested 48 h later, fixed with 3% paraformaldehyde, and analyzed by FRET assays as described in Materials and Methods. A region of interest (ROI) in the cell was selected, and the mCherry was bleached to 30% of its intensity at the ROI. The increase in the intensity of GFP after photobleaching of mCherry was determined, and the FRET efficiency between the donor (GFP) and the acceptor (mCherry) was calculated as described in Materials and Methods. FRET was observed only between the pp150-mCherry and BicD1-GFP pair and compared with the FRET seen in the positive-control GFP-mCherry fusion protein. Error bars indicate standard deviations. (B) FRET between pp150 and Bicaudal D1 was measured in HCMV-infected HFFs as described in Materials and Methods. Briefly, HCMV-infected HFF cells were fixed at 5 days postinfection with 3% paraformaldehyde. The cells were reacted with anti-pp150 MAb, anti-BicD1 rabbit antiserum, and TRITC-conjugated goat anti-mouse IgG2b and FITC-conjugated goat anti-rabbit secondary antibodies, respectively. FRET was measured between FITC and TRITC-labeled proteins in the assembly compartment (AC) as well as in the cytoplasmic vesicles in infected cells. As a negative control, FRET was measured between pp28 and BicD1 using anti-pp28 MAb and anti-BicD1 rabbit antibody and using TRITC-conjugated goat anti-mouse IgG2a and FITC-conjugated goat anti-rabbit secondary antibodies, respectively.

