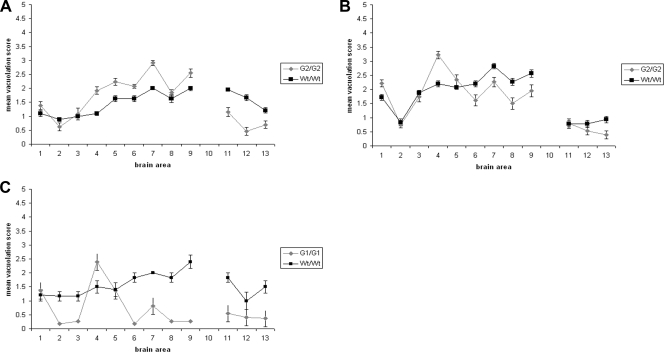
FIG. 4.
Lesion profile analysis of wild-type and PrP glycosylation mutant homozygous mice after peripheral inoculation with 79A or ME7. Spongiform degeneration in brains of the clinically positive wild-type, G2, and G1 mice was analyzed after peripheral infection with 79A or ME7. For this purpose nine gray matter areas were scored on a scale of 0 to 5 (y axis). Gray matter areas are represented on the x axis by the following numbers: 1, dorsal medulla; 2, cerebellar cortex; 3, superior colliculus; 4, hypothalamus; 5, medial thalamus; 6, hippocampus; 7, septum; 8, cerebral cortex; and 9, forebrain cortex. Three white matter areas were scored on a scale of 0 to 3 (y axis). White matter areas are represented on the x axis by the following numbers: 11, cerebellar white matter; 12, mesencephalic tegmentum; and 13, pyramidal tract. The magnitude of spongiform degeneration in the transgenic mice was then compared with the one in wild-type mice. Graphs show lesion profile analysis of the brains of the mice indicated on the figure after infection with strains 79A (A and C) and ME7 (B). The mean score for each area is shown (error bars ± standard error of the mean [SEM]).

