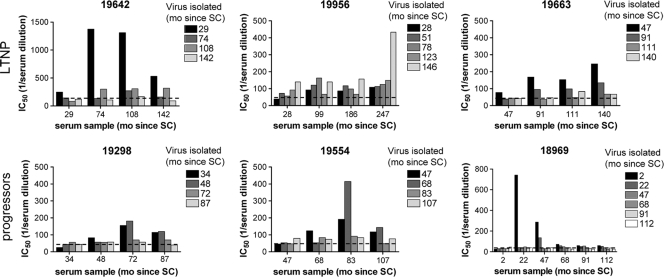
FIG. 3.
Development of autologous humoral immune responses during the course of infection in three LTNP (top) and three progressors (bottom). The average IC50s, determined by linear regression, of ≤5 virus variants per time point are indicated. The time points of virus isolation are indicated in the top right corner of each panel. Bars with identical shading represent inhibition of virus isolates from one time point by sera of different time points (as indicated on the x axis). The dashed lines represent background measurements using pooled sera from healthy uninfected individuals. Note that the maximum value on the y axis in the graph of participant H19642 and H18969 are higher than in the other graphs. IC50, 50% inhibitory concentration; mo, months; SC, seroconversion.

