FIG. 2.
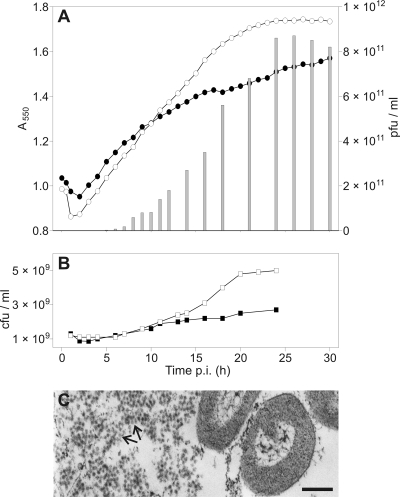
Production of HHPV-1 in a batch culture. (A) The turbidity (A550) of infected (•) and uninfected (○) cultures, as well as the number of free viruses (░⃞) were monitored. The time of infection was at 0 hpi. (B) The number of CFU of the infected (▪) and uninfected (□) culture. Panels A and B are shown in the same time scale. (C) Thin-section electron micrographs of the infected culture. The number of extracellular viruses grew in the course of time resulting in large clusters of viruses (arrows) at 23 hpi. Bar, 200 nm.

