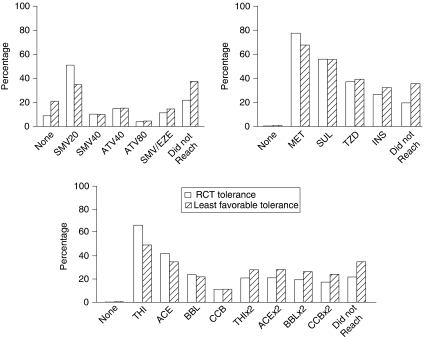
Figure 1.
Distribution of Treatments Following Intensification for Two Levels of Assumed Tolerance to Treatment
Note. Simulation results that assumed tolerance levels of randomized controlled trials are depicted with solid bars. Striped bars reflect the least favorable tolerance assumptions (10 percentage points higher discontinuation and 80 percent adherence relative to randomized trials). All results reflect the subpopulation of subjects on no treatments at baseline and assume that metformin is not contraindicated for any subject.

