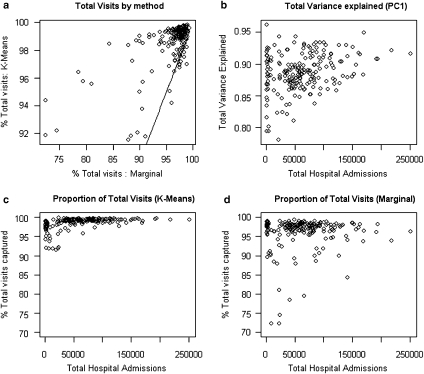
Figure 2.
Proportion of Total Visits and Variance Included in the Catchment Area by Model Type
Note. Tests of relative proportions of all hospital admissions or variance explained by the two methods. (a) plots the proportion of the total hospital admissions that comes from the catchment area for the two methods. The line in this figure indicates the points, where the K-means and Marginal methods capture the same proportion of total hospital admissions. For all hospitals to the left of this line, the K-means method captures a higher proportion of admissions than the Marginal; for hospitals to the right of the line, the opposite applies. (b) shows the proportion of total variance that is explained by PC1. (c) and (d) plot the two axes of (a) separately, against total hospital admissions, with y-axes on the same scale. Neither plot is well explained by a power law.

