Figure 1.
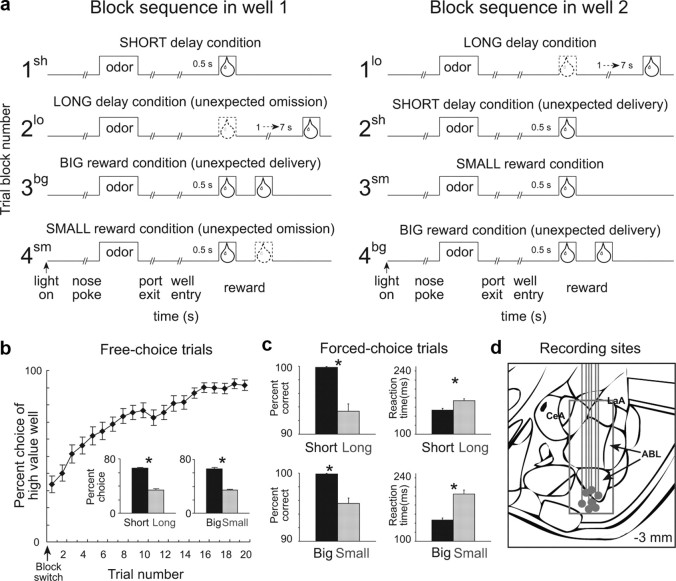
Task, behavior, and recording sites. a, Line deflections indicate the time course of stimuli (odors and rewards) presented to the animal on each trial. Other trial events are listed below. At the start of each recording session, one well was randomly designated as short (a 0.5 s delay before reward) and the other long (a 1–7 s delay before reward) (block 1). In the second block of trials these contingencies were switched (block 2). In blocks 3–4, we held the delay constant while manipulating the number of the rewards delivered. b, The impact of delay length and reward size choice behavior on free-choice trials. Bar graphs show average percentage choice for short versus long or big versus small across all free-choice trials. c, The impact of delay length and reward size on behavior on forced-choice trials. Bar graphs show percentage correct (left) and reaction time (right) across all recording sessions for different delays (top) and sizes (bottom). d, Location of recording sites. Gray dots represent final electrode position. Gray box marks extent of recording sites. Asterisks indicate planned comparisons revealing statistically significant differences (t test, p < 0.05). CeA, Central nucleus of amygdala; LaA, lateral amygdala; ABL, basolateral amygdala. Error bars indicate SEMs.

